


When Did The US Housing Market Crash
The most recent US Housing Market Crash took place between 2007 and 2009, with the most dramatic impacts of the crash occurring in 2008.
The 2008 housing market crash was one of the primary causes of the global financial crisis, wreaking havoc on the financial stability of entire economies the world over. While there are several factors that contributed to the US housing market crash, there are two that stand out above the rest.
1 – The US Housing Bubble Popped: A housing bubble occurs when there is a rapid increase in the market value of housing, followed by an even faster decrease in value, which is the ‘crash’ or ‘bursting of the bubble.’ Simply put, house prices in the US were wildly overinflated, market sentiment was overly optimistic and a market correction was bound to occur.
2 – Borrowers Couldn’t Payback Their Loans: This is called the subprime mortgage crisis. A subprime mortgage is a housing loan issued to borrowers with low credit ratings. It literally means that the borrower can’t qualify for a prime mortgage, because the risk of them defaulting on the loan is too high.
Importantly, the US housing market was overloaded with subprime mortgages, and borrowers started to default on loans that should never have been issued in the first place. US lending institutions effectively created a housing market time bomb. The fuse was lit in 2007, before fully exploding in 2008. The impacts of this economic bomb spread throughout the world, leading to the global financial crisis.
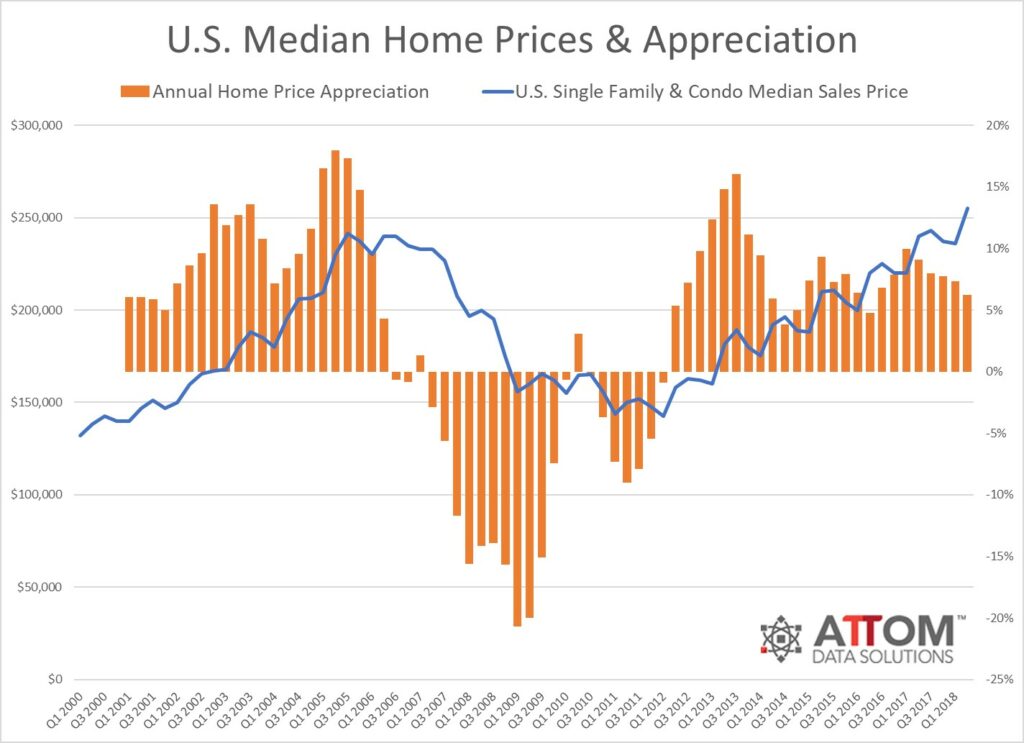
In this excellent infographic from Attom Data Solutions, you can clearly see just how drastically US house prices depreciated in value from 2007 to 2009. Foreclosures soared, house prices plummeted and the consequences of widespread irresponsible lending practices came to bear.
Timeline Of Major Housing Crashes In The US
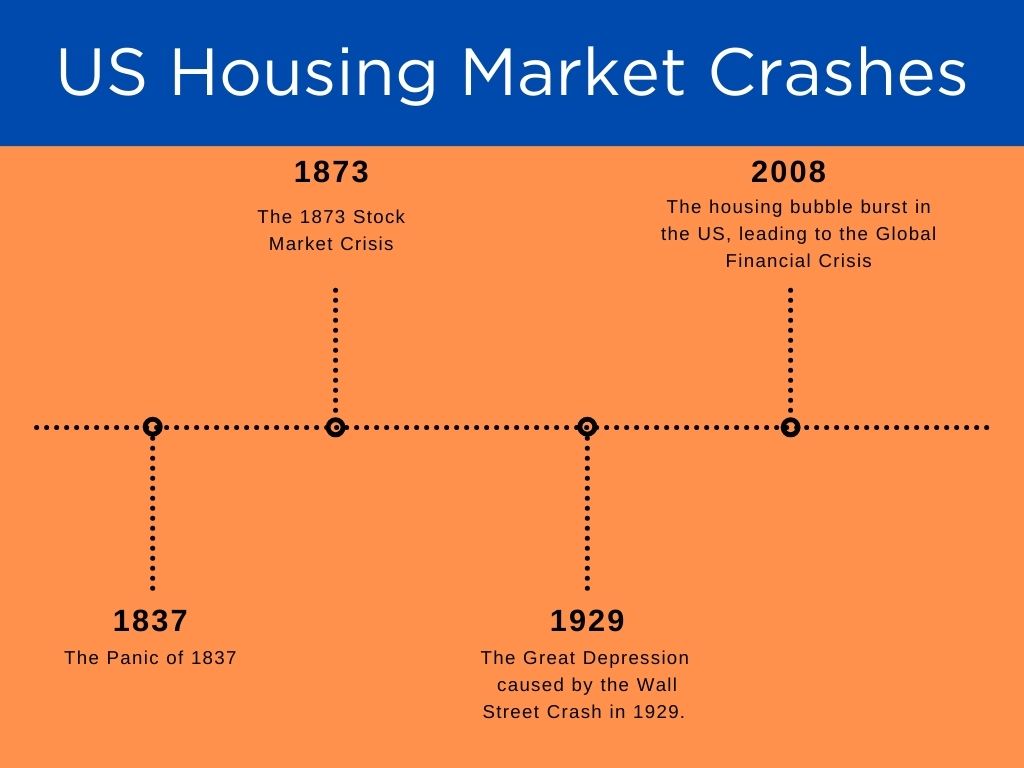
US House Market Crashes - In Order
The Panic of 1837
| Start Date: 1837 | End Date: Mid 1840s |
|---|
The hundred years between 1800 and 1900 were trademarked by several peaks and busts in the real estate market, reminiscent of the markets today. The most prominent, early example took place in 1837 when the stock market peaked and launched a depression that would last until the 1840s. Known as the ‘Panic of 1837’, this financial crisis lasted until the late 1840s.
The Panic of 1837 can be attributed to both domestic and international causes. Speculative lending standards, a land bubble on the edge of bursting, and a decline in the price of cotton all had a severe impact on the economy.
By May of 1837, banks began to suspend payments and loans, and a recession lasting close to 7 years began. During this recession, the fallout caused banks and businesses to close their doors, workers to become unemployed numbering into the thousands, and the rate of joblessness to spike as high as 25%.
Bank lending would only become prominent again after the gold rush of 1849, with people establishing new lines of credit. With news spreading about the discovery of gold in multiple locales, there was a mass migration to these highly valuable areas. This was only a brief respite, however, as the Civil War broke out in the early 1860s. 2% of the US population was decimated by the time the war ended.
By 1873, a new crisis emerged prompted by falling stock prices, leading to below-average interest rates lasting several years. With a similar dip taking place in the 1890s, interest rates continued to stay low going into the 1900s, starting the new century on the back foot.
The 1873 Stock Market Crisis
| Start Date: 1873 | End Date: 1877 |
|---|
The 1873 Stock Market Crisis, or Panic of 1873, originated in the US but had global repercussions, triggering widespread economic downturn and financial instability. It was fueled by speculative railroad expansion, leading to over-investment and subsequent decline in railroad securities.
Full scale bank collapses contributed to the economic turmoil of the time with several highly established banks falling on their knees. The most notable example was Jay Cooke & Company’s collapse due to overinvestment in railroad stocks and securities. This ultimately led to widespread societal panic, a swarm of bank runs, and multiple bank collapses nationwide.
While the Panic of 1873 affected various sectors, its impact on the US housing market was indirect but significant. Credit contraction limited access to loans, decreasing demand for housing. Economic downturn and declining incomes further suppressed housing demand. Depression and deflation led to property value decline, widespread foreclosures and increasingly challenging housing market conditions.
The Great Depression (1929 - 1939)
| Start Date: 1929 | End Date: 1939 |
|---|
The most notable crash of the 1900s took place in 1929, with the crash of Wall Street leading to the Great Depression. As a result of the crash, prices fell up to 67% with properties plummeting in value and bank lending decreasing as well. Just a decade before the real estate market had been booming with markets like Manhattan in New York representing almost 10% of all real estate wealth in the country. This same market lost over half it’s value by the end of 1933. The repercussions of this crash are thought to have affected property markets until 1960 when prices finally recovered.
The depression would continue until after the second world war where the economy and real estate markets were able to rebuild. The next cycle of real estate remained stable until the stock market hit another low in 1974. Leading up to the year 1970 inflation rose from under 2% to over 6%, causing the cost of a new home to nearly double. Home prices continued to grow over the next 20 years, bolstered by legislation encouraging banks and lenders to grant funding with little regulatory oversight.
Until the end of the 1990s, the market was boosted by increases in real estate collateral and growing credit options. On the surface, all appeared to be well, but there were still significant issues for real estate investors. A savings and loan crisis caused interest rates to rise, new home construction dropped to its lowest since World War II and housing prices were flat until the end of 1997.
The 2008 Housing Bubble
| Start Date: 2007 | End Date: 2010 |
|---|
Going into the early 2000s, the US and the rest of the world was going through a housing bubble. The rate of mortgage fraud skyrocketed, and the country entered into the century with an early recession. Despite these facts, the mortgage denial rate halved between 1997 and 2003.
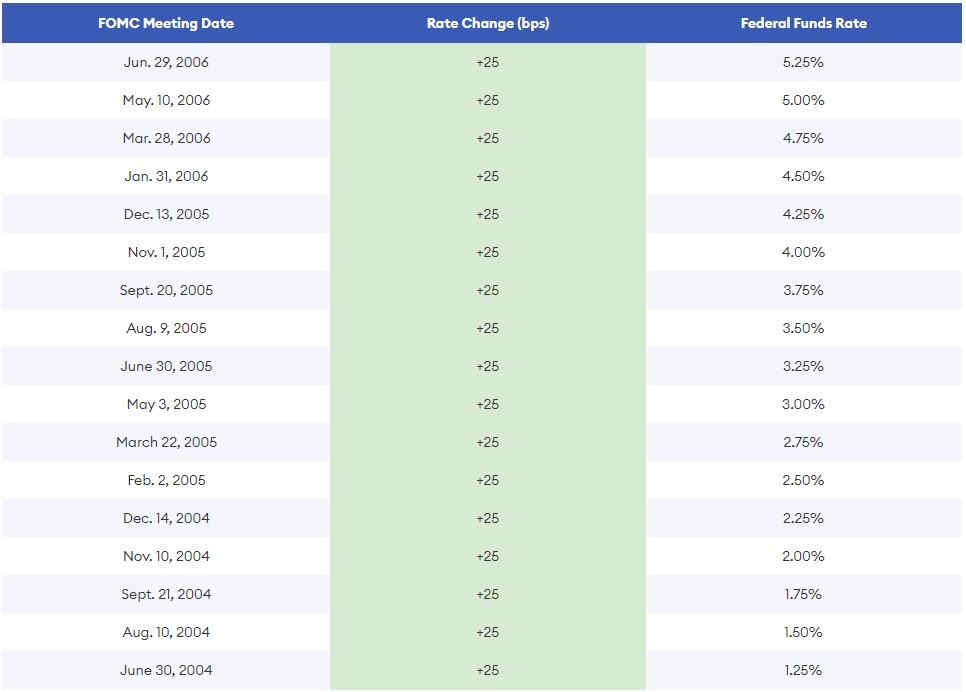
From June 30 2004 to June 29 2006, the Federal reserve hiked rates from 1.25% all the way to 5.25% to put off inflation. This caused a significant increase in the cost of lending and many borrowers saw their loan repayments escalate by 60%.
During these few years, the Federal Reserve also had a looser approach to supervising banks and lenders, many of which abandoned loan standards such as measuring employment and income history in borrowers. With the cost of lending increasing so greatly and markets going through a correction, the bubble had officially been burst.
In 2007, real estate crashed completely with hundreds of thousands of homes going into foreclosure, multiple subprime lenders declaring bankruptcy and the market requiring government bailouts. The market continued to slow down, with flat prices and home sales being the biggest trend. The subprime mortgage industry suffered widespread collapses, including the closure of some of the nation’s biggest lenders at the time like New Century Financial and Lehman Brothers. Real estate was not the only industry affected, with many other fields experiencing bankruptcies due to the credit crises. The global stock market also faced correction and volatility.
Considered to be one of the biggest economical declines since the Great Crash of 1929, the 2008 housing market is still having palpable effects on the economy that are still being felt today.
Has The US Housing Market Fully Recovered From The 2008 Crash?

In a word, yes. It took about 6 years for the median sales price of houses sold in the US to fully recover:
- Median Sales Price Q1 2007: $257,400
- Median Sales Price Q1 2013: $258,400
Perhaps more importantly, the housing market experienced excellent growth from 2014 to 2022.
- Median Sales Price Q1 2014: 275,200
- Median Sales Price Q4 2022: 479,500
It’s worth noting that the covid-19 pandemic actually had a positive impact on property prices, despite all the initial fears about a worldwide economic collapse. Much of the immense growth from mid-2020 to the end of 2022 was led by two of the most powerful economic forces, namely supply and demand.
Broadly speaking, the covid-19 pandemic had a negative impact on supply. People were holding onto their homes, and this created an imbalance between supply (low) and demand (high). In addition, interest rates dropped to record low levels, which further stimulated demand. This combination of forces resulted in one of the most impressive periods of home appreciation in US history.
However, the house prices have declined since the peak in Q4 2022, as the market is moving toward a more balanced position in 2024 and beyond.
- Median Sales Price Q4 2022: 479,500
- Median Sales Price: Q4 2023: $417,700
It’s clear to see that higher interest rates and much higher inventory levels have put more power in the hands of the buyer. A course correction like this is perfectly healthy and should serve as welcome news for first time buyers hoping to enter the market.
Ultimately, the US housing market is currently in a relatively stable position. Prices are slowly but surely trending upwards again after a dip between 2022 and 2023. Zillow is forecasting a 1.4% one-year increase in home values, which is neither exciting nor alarming. Instead, it simply reaffirms that real estate is a remarkably stable asset class that can bounce back from even the harshest economic downturns. It may take time, but the housing market always recovers.
Is Another Crash Likely To Happen?
We have already noted that real estate prices tend to operate in 18-year cycles, and it has been almost 16 years since the 2008 bubble burst. Regardless of what the past may tell us, there isn’t much evidence to suggest that the US housing market is heading toward a widespread collapse.

Even though some markets have experienced home price declines, a housing market crash is not likely to occur in 2024. There is a record low in housing inventory, which means that a rapid drop in the current high home prices is not likely, and therefore a housing market crash is even less likely this year. Some markets may see a home price decline, National Association of Realtors chief economist Lawrence Yun says, “Will some markets see a price decline? Yes. [But] with the supply not being there, the repeat of a 30 percent price decline is highly, highly unlikely.”
Homeowners, according to the experts, are also in a better position than they were in the 2008 market crash. This is because overall, homeowners in the US have more equity in their homes and there are far more buyers than sellers in the market. This lends itself to a sustained demand, and not enough supply. A decrease in mortgage rates would see homebuyers start flooding the market, according to Dave Liniger, the founder of real estate brokerage RE/MAX, and this would create another boom-and-bust cycle where home prices would soar again.
In a nutshell, while home prices may fall, they are highly unlikely to crash like they did in 2008. Homeowners are in a much stronger position than they were back then in terms of home equity and personal credit.
In addition, various acts and policies have been implemented to prevent the possibility of widespread irresponsible lending by large US banks and financial institutions. For instance, since the 2008 financial crisis, US lawmakers have introduced:
The Dodd-Frank Act: Legislation to make the US financial system safer and prevent a repeat of the excessive risk-taking that lead to the 2007-2008 financial crisis.
Consumer Financial Protection Bureau (CFPB): This is an agency which monitors and protects the financial interests of American consumers.
Financial Stability Oversight Council (FSOC): This council is responsible for monitoring risks to the US financial sector associated with large banks or financial holding companies. It is effectively a watchdog designed to identify red flags and irresponsible lending practices that could derail the stability of the US housing market and greater US economy.
Add to this the fact that builders are being cautious with construction and the result is a continued shortage of inventory, rather than the excessive market flooding that occurred in 2008.
Ultimately, the US property market appears to be as safe as houses in the short term and mid term future.